File:Patterns Figure13.jpg

Original file (1,033 × 801 pixels, file size: 78 KB, MIME type: image/jpeg)
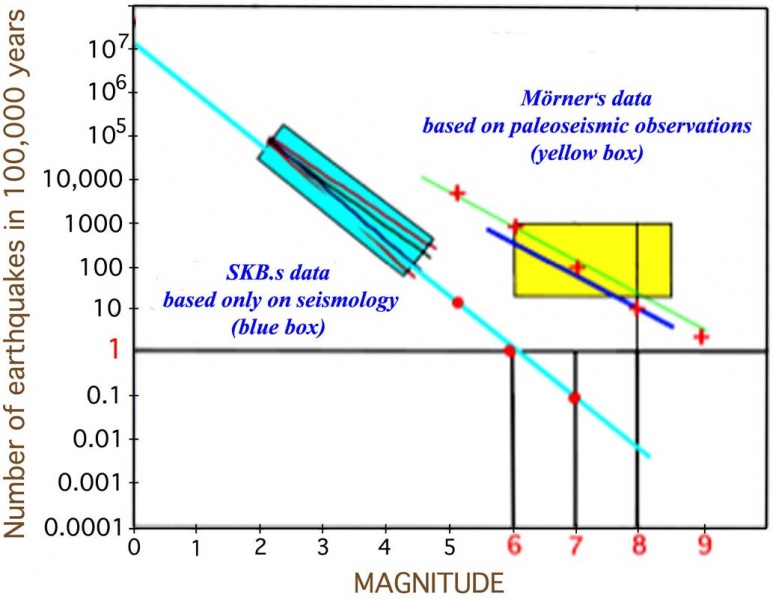
figure 13 - part of Patterns in seismology and palaeoseismology, and their application in long-term hazard assessments - the Swedish case in view of nuclear waste management.
Figure 13. Seismic hazard assessment for the next 100 000 yr, partly (in blue) as done by La Pointe et al. (2000) on the basis of present seismological data (blue box and extrapolated line suggesting 10 M5 events, 1 M6 event and 0.1 M7 events in 100 000 yr for the Forsmark area), and partly by converting the palaeoseismic observational records (yellow box: Mörner, 2003, 2011) in a similar way to the 100 000 situation (suggesting 10 000 M5 events, 1000 M6 events, 100 M7 events, 10 M8 events and a few M9 events for the region with a radius of 250 km around Forsmark).
Original source: Scientific paper provided by N.-A. Mörner. Published originally on July 24, 2013 in Pattern Recognition in Physics (PRP)
File history
Click on a date/time to view the file as it appeared at that time.
| Date/Time | Thumbnail | Dimensions | User | Comment | |
|---|---|---|---|---|---|
| current | 23:14, 29 November 2013 | | 1,033 × 801 (78 KB) | Falk (talk | contribs) | figure 13 - part of Patterns in seismology and palaeoseismology, and their application in long-term hazard assessments - the Swedish case in view of nuclear waste management. '''Figure 13.''' Seismic hazard assessment for the next 100 000 yr, part... |
You cannot overwrite this file.
