File:Patterns Figure2.jpg
Patterns_Figure2.jpg (527 × 193 pixels, file size: 13 KB, MIME type: image/jpeg)
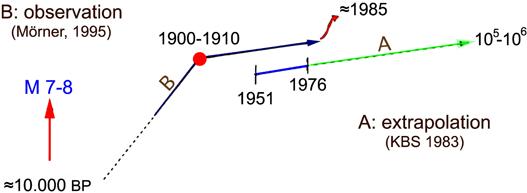
figure 2 - part of Patterns in seismology and palaeoseismology, and their application in long-term hazard assessments - the Swedish case in view of nuclear waste management.
Figure 2. Dimensionless sketch (from Mörner, 1995) illustrating the remarkable long-term prediction by KBS (now: SKB) who analysed the seismicity during 25 yr, 1951–1975 (blue line), and made predictions for 100 000 to 1 million years (A: green line; KBS, 1983). Mörner (1995; B observation) showed that seismic energy release changed drastically a century ago and that Sweden was a highly seismic area during the time of deglaciation some 10 000 yr ago. Furthermore, the seismic activity increased drastically in the mid-1980s (invalidating the green line extrapolation). This indicates that palaeoseismology is the key to serious long-term seismic hazard prediction.
Original source: Scientific paper provided by N.-A. Mörner. Published originally on July 24, 2013 in Pattern Recognition in Physics (PRP)
File history
Click on a date/time to view the file as it appeared at that time.
| Date/Time | Thumbnail | Dimensions | User | Comment | |
|---|---|---|---|---|---|
| current | 14:07, 29 November 2013 | 527 × 193 (13 KB) | Falk (talk | contribs) | figure 2 - part of Patterns in seismology and palaeoseismology, and their application in long-term hazard assessments - the Swedish case in view of nuclear waste management. '''Figure 2.''' Dimensionless sketch (from Mörner, 1995) illustrating th... |
You cannot overwrite this file.
