File:Patterns Figure4.jpg
Original file (1,033 × 641 pixels, file size: 62 KB, MIME type: image/jpeg)
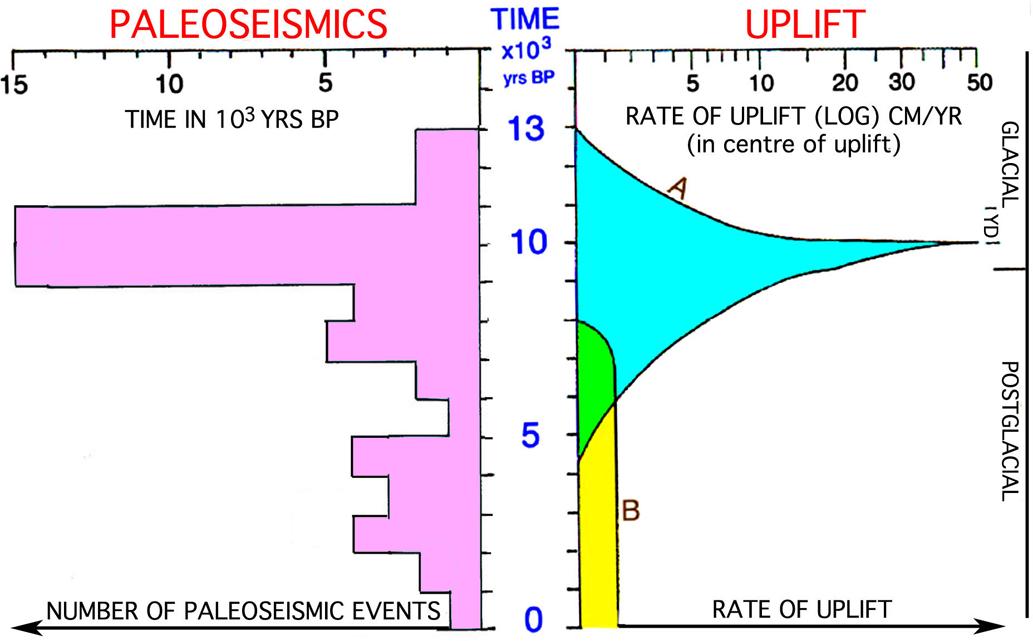
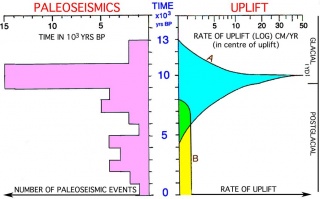
figure 4 - part of Patterns in seismology and palaeoseismology, and their application in long-term hazard assessments - the Swedish case in view of nuclear waste management.
Figure 4. Cumulative distribution over time of the 59 events in the Swedish Paleoseismic-logical Catalogue (Appendix A; Mörner, 2003, 2011). There is a distinct peak in the period 11 000–9000 BP, which is the time of the peak rate of glacial isostatic uplift (left curve).
Original source: Scientific paper provided by N.-A. Mörner. Published originally on July 24, 2013 in Pattern Recognition in Physics (PRP)
File history
Click on a date/time to view the file as it appeared at that time.
| Date/Time | Thumbnail | Dimensions | User | Comment | |
|---|---|---|---|---|---|
| current | 16:29, 29 November 2013 | | 1,033 × 641 (62 KB) | Falk (talk | contribs) | figure 4 - part of Patterns in seismology and palaeoseismology, and their application in long-term hazard assessments - the Swedish case in view of nuclear waste management. '''Figure 4.''' Cumulative distribution over time of the 59 events in the... |
You cannot overwrite this file.
