File:Patterns Figure5.jpg

Original file (1,033 × 806 pixels, file size: 74 KB, MIME type: image/jpeg)
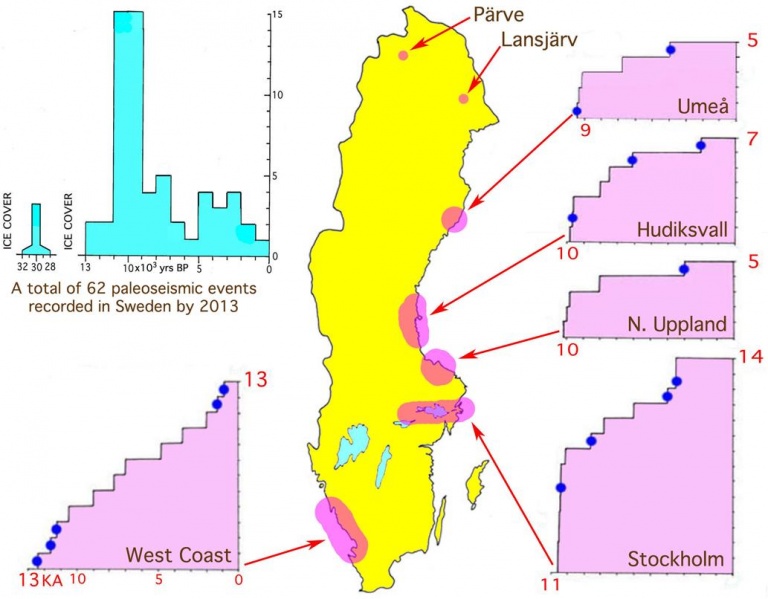
figure 5 - part of Patterns in seismology and palaeoseismology, and their application in long-term hazard assessments - the Swedish case in view of nuclear waste management.
Figure 5. Distribution of palaeoseismic events in Sweden; partly in time (top left; where 50 % of the events fall in the period of maximum rates of uplift; cf. Fig. 4) and partly by area where recurrence diagrams have been constructed for five individual areas (including 44 events, or 71 % of all the events). Blue dots refer to simultaneous tsunami events.
Original source: Scientific paper provided by N.-A. Mörner. Published originally on July 24, 2013 in Pattern Recognition in Physics (PRP)
File history
Click on a date/time to view the file as it appeared at that time.
| Date/Time | Thumbnail | Dimensions | User | Comment | |
|---|---|---|---|---|---|
| current | 16:31, 29 November 2013 | | 1,033 × 806 (74 KB) | Falk (talk | contribs) | figure 5 - part of Patterns in seismology and palaeoseismology, and their application in long-term hazard assessments - the Swedish case in view of nuclear waste management. '''Figure 5.''' Distribution of palaeoseismic events in Sweden; partly in... |
You cannot overwrite this file.
