File:Patterns Figure10.jpg
Original file (1,033 × 720 pixels, file size: 75 KB, MIME type: image/jpeg)
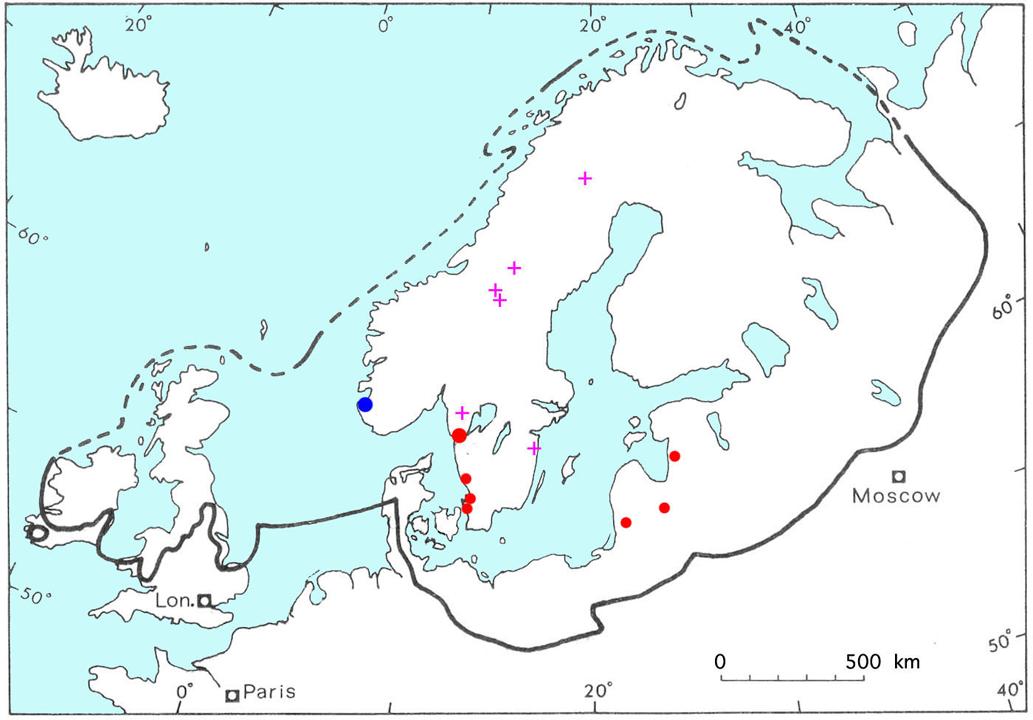
figure 10 - part of Patterns in seismology and palaeoseismology, and their application in long-term hazard assessments - the Swedish case in view of nuclear waste management.
Figure 10. Extension of the ice cap over northern Europe at the glaciation maximum around 20 000 yr ago (tick line) and records of palaeoseismic events during the interstadial period around 30 000 BP; red dots = palaeoseismic liquefaction structures; blue dot = heavy faulting; purple crosses = dated precipitation of uranium in fractures (during this interstadial a substantial ice sheet persisted, but the limits are much debated).
Original source: Scientific paper provided by N.-A. Mörner. Published originally on July 24, 2013 in Pattern Recognition in Physics (PRP)
File history
Click on a date/time to view the file as it appeared at that time.
| Date/Time | Thumbnail | Dimensions | User | Comment | |
|---|---|---|---|---|---|
| current | 22:41, 29 November 2013 | | 1,033 × 720 (75 KB) | Falk (talk | contribs) | figure 10 - part of Patterns in seismology and palaeoseismology, and their application in long-term hazard assessments - the Swedish case in view of nuclear waste management. '''Figure 10.''' Extension of the ice cap over northern Europe at the gl... |
You cannot overwrite this file.
