Difference between revisions of "Patterns in seismology and palaeoseismology, and their application in long-term hazard assessments - the Swedish case in view of nuclear waste management"
m |
(copy process continued) |
||
| Line 18: | Line 18: | ||
|- | |- | ||
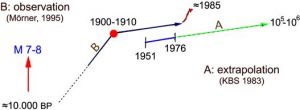
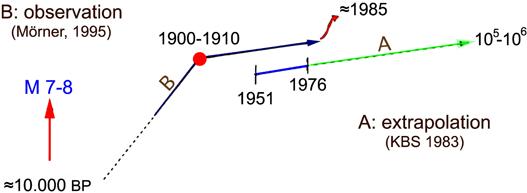
|[[File:Patterns Figure2.jpg|thumb|right|'''Figure 2.''' Dimensionless sketch (from Mörner, 1995) illustrating the remarkable long-term prediction by KBS (now: SKB) who analysed the seismicity during 25 yr, 1951–1975 (blue line), and made predictions for 100 000 to 1 million years (A: green line; KBS, 1983). Mörner (1995; B observation) showed that seismic energy release changed drastically a century ago and that Sweden was a highly seismic area during the time of deglaciation some 10 000 yr ago. Furthermore, the seismic activity increased drastically in the mid-1980s (invalidating the green line extrapolation). This indicates that palaeoseismology is the key to serious long-term seismic hazard prediction.]] | |[[File:Patterns Figure2.jpg|thumb|right|'''Figure 2.''' Dimensionless sketch (from Mörner, 1995) illustrating the remarkable long-term prediction by KBS (now: SKB) who analysed the seismicity during 25 yr, 1951–1975 (blue line), and made predictions for 100 000 to 1 million years (A: green line; KBS, 1983). Mörner (1995; B observation) showed that seismic energy release changed drastically a century ago and that Sweden was a highly seismic area during the time of deglaciation some 10 000 yr ago. Furthermore, the seismic activity increased drastically in the mid-1980s (invalidating the green line extrapolation). This indicates that palaeoseismology is the key to serious long-term seismic hazard prediction.]] | ||
| + | |- | ||
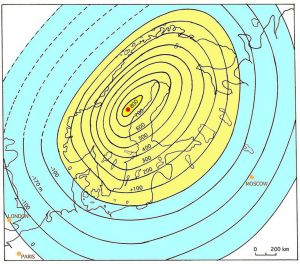
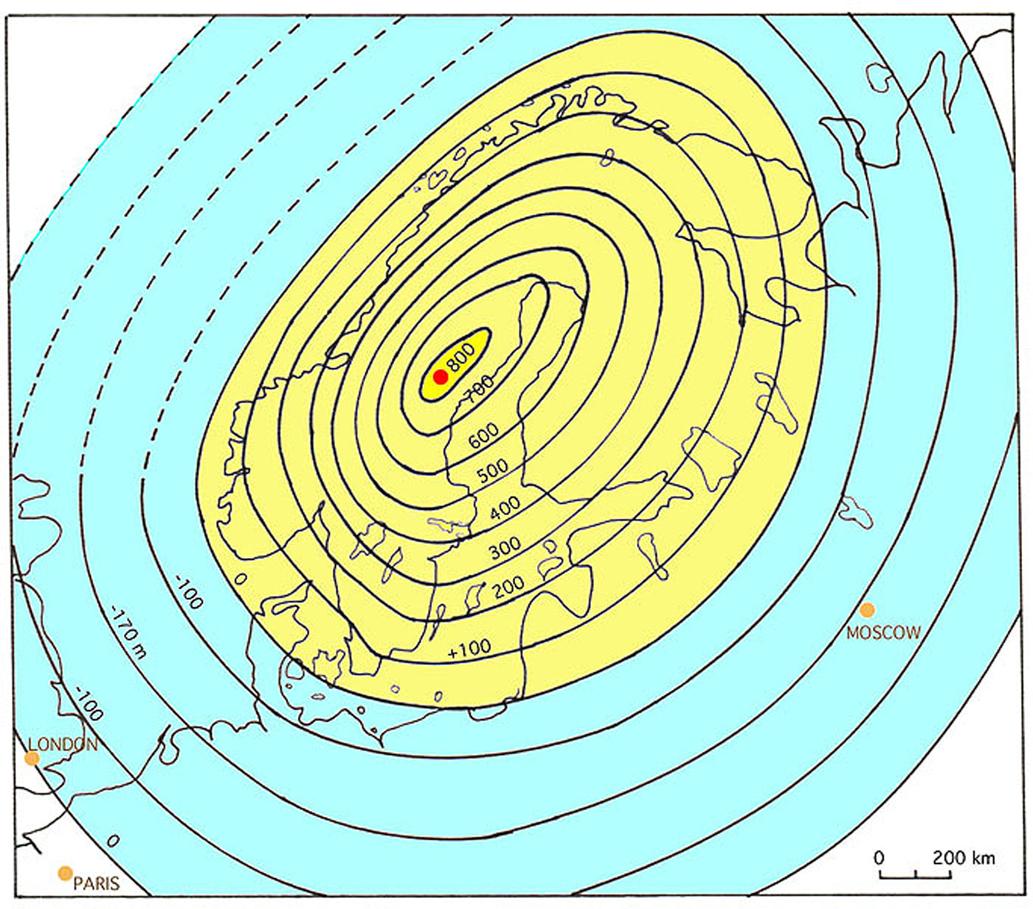
| + | |[[File:Patterns Figure3.jpg|thumb|right|'''Figure 3.''' The postglacial uplift cone of Fennoscandia (yellow) with a surrounding subsidence trough (blue). Isobases give uplift and subsidence in metres over the last 15 000 yr. At the time of deglaciation the rate of uplift peaked with values 10 times higher than that of plate tectonics. The vertical uplift was linked to horizontal extension in the radial and tangential directions.]] | ||
| + | |- | ||
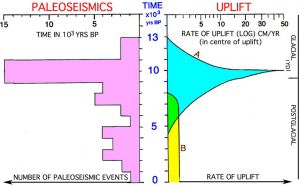
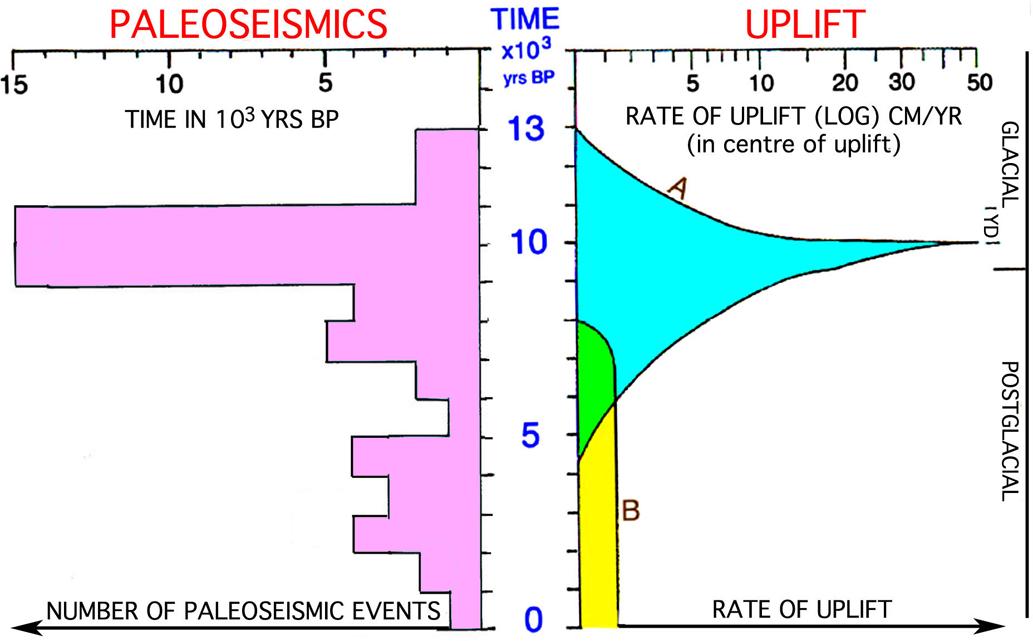
| + | |[[File:Patterns Figure4.jpg|thumb|right|'''Figure 4.''' Cumulative distribution over time of the 59 events in the Swedish Paleoseismic-logical Catalogue (Appendix A; Mörner, 2003, 2011). There is a distinct peak in the period 11 000–9000 BP, which is the time of the peak rate of glacial isostatic uplift (left curve).]] | ||
| + | |- | ||
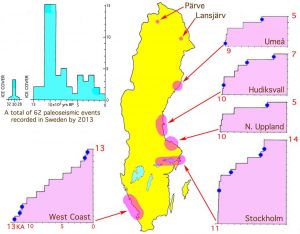
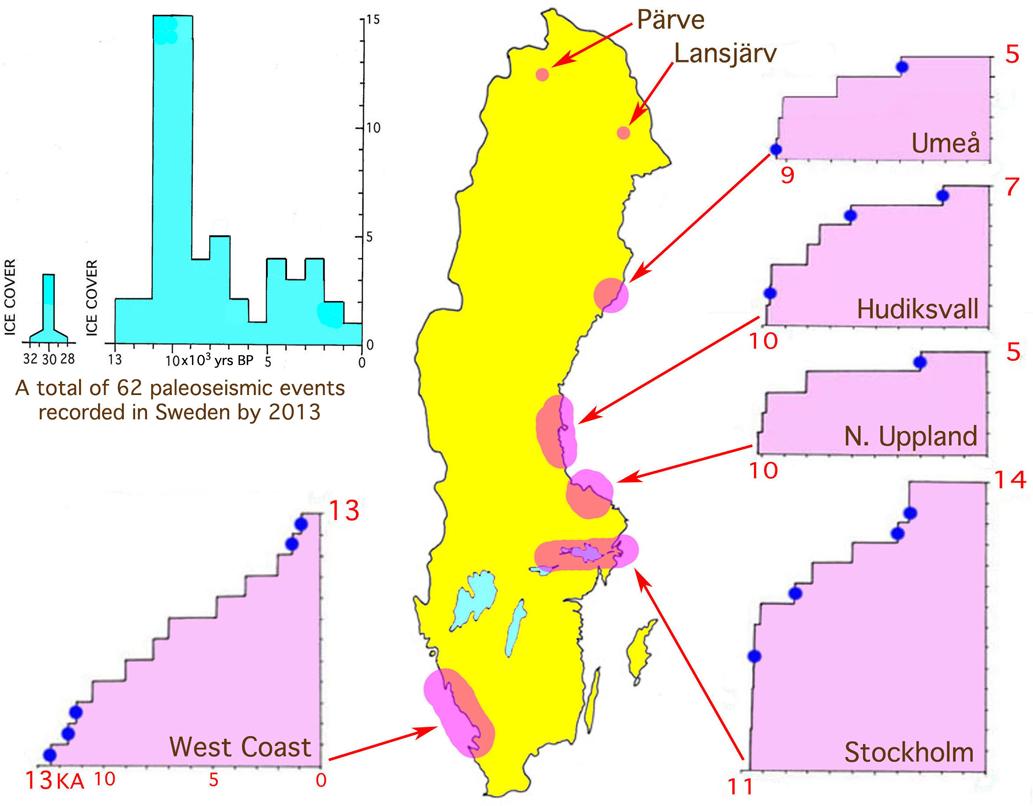
| + | |[[File:Patterns Figure5.jpg|thumb|right|'''Figure 5.''' Distribution of palaeoseismic events in Sweden; partly in time (top left; where 50 % of the events fall in the period of maximum rates of uplift; cf. Fig. 4) and partly by area where recurrence diagrams have been constructed for five individual areas (including 44 events, or 71 % of all the events). Blue dots refer to simultaneous tsunami events.]] | ||
|- | |- | ||
|} | |} | ||
| Line 71: | Line 77: | ||
[[File:Patterns Figure2.jpg|center|'''Figure 2.''' Dimensionless sketch (from Mörner, 1995) illustrating the remarkable long-term prediction by KBS (now: SKB) who analysed the seismicity during 25 yr, 1951–1975 (blue line), and made predictions for 100 000 to 1 million years (A: green line; KBS, 1983). Mörner (1995; B observation) showed that seismic energy release changed drastically a century ago and that Sweden was a highly seismic area during the time of deglaciation some 10 000 yr ago. Furthermore, the seismic activity increased drastically in the mid-1980s (invalidating the green line extrapolation). This indicates that palaeoseismology is the key to serious long-term seismic hazard prediction.]] | [[File:Patterns Figure2.jpg|center|'''Figure 2.''' Dimensionless sketch (from Mörner, 1995) illustrating the remarkable long-term prediction by KBS (now: SKB) who analysed the seismicity during 25 yr, 1951–1975 (blue line), and made predictions for 100 000 to 1 million years (A: green line; KBS, 1983). Mörner (1995; B observation) showed that seismic energy release changed drastically a century ago and that Sweden was a highly seismic area during the time of deglaciation some 10 000 yr ago. Furthermore, the seismic activity increased drastically in the mid-1980s (invalidating the green line extrapolation). This indicates that palaeoseismology is the key to serious long-term seismic hazard prediction.]] | ||
| + | |||
| + | |||
| + | [[File:Patterns Figure3.jpg|center|'''Figure 3.''' The postglacial uplift cone of Fennoscandia (yellow) with a surrounding subsidence trough (blue). Isobases give uplift and subsidence in metres over the last 15 000 yr. At the time of deglaciation the rate of uplift peaked with values 10 times higher than that of plate tectonics. The vertical uplift was linked to horizontal extension in the radial and tangential directions.]] | ||
| + | |||
| + | === Using the palaeoseismic records === | ||
| + | With the introduction of palaeoseismological studies in Sweden, it became evident that the seismic activity had changed considerably back in time (e.g. Mörner, 1985, 1991, 2003, 2011; Mörner et al., 2000), primarily as a function of the very high rates of glacial isostatic uplift at the time of deglaciation some 10 000 yr ago. The uplift of Fennoscandia has the form of a somewhat skewed cone (Fig. 3) with a maximum uplift of 800 m in 13 000 yr. This means very high vertical rates of uplift, which exceed the maximum horizontal plate motions by a factor of ten. At the same time, the horizontal extensional forces in the radial and tangential directions are high, giving strain rates up to two ten potencies higher than today. Therefore, it is not surprising that Fennoscandia, at the time of deglaciation, was a highly seismic area (Fig. 4), despite the fact that it represents an intra-plate shield area. | ||
| + | |||
| + | [[File:Patterns Figure4.jpg|center|'''Figure 4.''' Cumulative distribution over time of the 59 events in the Swedish Paleoseismic-logical Catalogue (Appendix A; Mörner, 2003, 2011). There is a distinct peak in the period 11 000–9000 BP, which is the time of the peak rate of glacial isostatic uplift (left curve).]] | ||
| + | |||
| + | The "seismic landscape" of Fennoscandia at the time of deglaciation is characterized by frequent high-magnitude palaeoseismic events (Figs. 4–5, Table 2, Appendix A). Mörner (2011) recorded 7 high-magnitude events during 102 yr from varve year 10 490 to 10 388 BP. Several events must have reached a magnitude of 8 to > 8 (Mörner, 2011). Active faults occur all from northernmost to southernmost Sweden (Mörner, 2004). In northernmost Fennoscandia, there are a number of very large and long fault scarps denoting high-magnitude events (or repeated movements) – i.e. in Norway (Olesen, 1988; Dehls et al., 2000), Sweden (Lundqvist and Lagerbäck, 1976; Bäckblom and Stanford, 1989; Lagerbäck, 1990) and Finland (Kujansuu, 1964) as shown on the map of “active tectonics and postglacial palaeoseismics” (Mörner, 2004, Fig. 5) | ||
| + | |||
| + | {| style="background:#ffffff; color:#000000; text-align:center; border-width:1px; border-color:#808080; border-style:solid;" | ||
| + | |+ '''''Table 1. Maximum earthquake magnitudes by time and methodology.''''' | ||
| + | |- style="background:#EEDC82; color:white;" | ||
| + | ! style="width:33%;" |Methodology | ||
| + | ! style="width:33%;" |Time unit | ||
| + | ! style="width:33%;" |Maximum magnitude | ||
| + | |||
| + | |- style="background:#FFF68F;" | ||
| + | | Seismology || style="text-align:left" | last 100 yr || < 4.8 | ||
| + | |||
| + | |- style="background:#EEE685;" | ||
| + | | Historical data || style="text-align:left" | last 600 yr || < 5.5 | ||
| + | |||
| + | |- style="background:#FFF68F;" | ||
| + | | Late Holocene PS || style="text-align:left" | last 5000 yr || >> 6 to ∼ 7 | ||
| + | |||
| + | |- style="background:#EEE685;" | ||
| + | | Deglacial phase PS || style="text-align:left" | 9–11 000 yr BP || >> 8 | ||
| + | |||
| + | |} | ||
| + | |||
| + | [[File:Patterns Figure5.jpg|center|'''Figure 5.''' Distribution of palaeoseismic events in Sweden; partly in time (top left; where 50 % of the events fall in the period of maximum rates of uplift; cf. Fig. 4) and partly by area where recurrence diagrams have been constructed for five individual areas (including 44 events, or 71 % of all the events). Blue dots refer to simultaneous tsunami events.]] | ||
Revision as of 16:39, 29 November 2013
First publication of this report in Pattern Recognition in Physics (PRP)
Pattern Recogn. Phys., 1, 75–89, 2013
www.pattern-recogn-phys.net/1/75/2013/
doi:10.5194/prp-1-75-2013
©Author(s) 2013. CC Attribution 3.0 License.
- N.-A. Mörner
- Paleogeophysics & Geodynamics, Rösundavägen 17, 13336 Saltsjöbaden, Sweden
- Correspondence to:
- N.-A. Mörner (morner AT pog.nu[1])
- Received: 12 May 2013 – Accepted: 1 July 2013 – Published: 24 July 2013
Abstract
Seismic events are recorded by instruments, historical notes and observational criteria in geology and archaeology. Those records form a pattern of events. From these patterns, we may assess the future seismic hazard. The time window of a recorded pattern and its completeness set the frames of the assessments. Whilst instrumental records in seismology only cover decades up to a century, archaeoseismology covers thousands of years and palaeoseismology tens of thousands of years. In Sweden, covered by ice during the Last Ice Age, the palaeoseismic data cover some 13 000 yr. The nuclear industries in Sweden and Finland claim that the high-level nuclear waste can be buried in the bedrock under full safety for, at least, 100 000 yr. It seems hard, if on the whole possible, to make such assessments from the short periods of pattern recognition in seismology (< 100 yr) and palaeoseismology (∼ 13 000 yr). All assessments seem to become meaningless, maybe even misleading. In this situation, we must restrict ourselves from making too optimistic an assessment. As some sort of minimum level of the seismic hazard, one may multiply the recorded seismic hazard over the past 10 000 yr by 10, in order to cover the required minimum time of isolation of the toxic waste from the biosphere of 100 000 yr.
Introduction
In China, we have a historical documentation of seismic events for the last 4250 yr (Wang, 1987; Mörner, 1989). This is, of course, quite unique. In most other areas, we have fragments recorded over a few hundred years, or so. The recording by permanent instruments (seismographs) began at the end of the 19th century. This means that instrumental records are limited to the last half-century to the last century.
The seismic destruction of monuments (i.e. archaeoseismology) goes back a few thousands of years (e.g. Sintubin, 2011; Stiros and Jones, 1996). Sometimes, mythology may provide information of past seismic events (Piccardi and Masse, 2007).
Palaeoseismology (or earthquake geology) refers to seismic effects as recorded in geology (McCalpin, 2009; Mörner, 2003; Reicherter et al., 2009; Silva et al., 2011). This implies that the records may date to any part of the geological time. With respect to seismic hazard assessment, we must, however, focus on the continual records of the Late Quaternary, especially the Holocene (e.g. Rockwell, 2010).
When we make seismic hazard assessments, there must be some sort of relation between the time frame of observation and the time frame of extrapolation. Seismology is good for assessment of the hazard of the near future – i.e. decades up to a century. When we are forced to make assessments for a longer time period, we have to rely on palaeoseismology (Fig. 1).
In the case of nuclear waste handling, the time span needed to be covered by seismic hazard assessment increases to the immense period of 100 000 yr or more (Mörner, 2012a). The question is whether we, by this, have not extended our predictions "in absurdum" (Mörner, 2001). The present paper will address this question. IAEA (2010) has tried to establish criteria and recommendations for seismic hazard assessment in association with nuclear power installations. The focus is on the installation of nuclear power plants. It seems relevant that they firmly state that the assessment must be based on "the use to the greatest possible extent of the information collected" ("available", I would add, in this case, when the nuclear power industries take the liberty to discriminate among available observational facts), and "in accordance with the nature and complexity of the seismotectonic environment" (in this case Fennoscandia). Furthermore, they state the following:
- The size of the relevant region may vary, depending on the geological and tectonic setting, and its shape may be asymmetric in order to include distant significant seismic sources of earthquakes. Its radial extent is typically 300 km. In intra-plate regions, and in the particular case of investigations into the potential for tsunamis, the investigations may need to consider seismic sources at very great distances from the site.
Results and records
In this paper we will address the situation in Sweden, because it is in Sweden and Finland (and only in those two countries) where the nuclear industry has claimed that they have a method of final deposition of the high-level waste in the bedrock that will stay intact for "at least, 100 000 years" (as claimed in Sweden) or "for 1 million years" (as claimed in Finland).
This calls for seismic hazard assessments. Because of the immense time period, we cannot apply normal means of assessment, however (Mörner, 2001, 2012c). The "methods" used are the following:
- Claiming what you want to claim without backing it up by observational records. Basically this is what the nuclear industry is doing.
- Analysing the present seismic records (in Sweden, the nuclear industry selected the time window 1951–1976) and making straight-line extrapolations into the distant future (KBS, 1983; La Pointe et al., 2000).
- Analysing the palaeoseismic records over the last 13 000 yr and multiplying the records for the time period of 100 000 yr (Mörner, 2003, 2011, 2012a).
- Substituting observations for computer modelling of the changes in stress and strain in the bedrock (Lambeck, 2005; Lund et al., 2009).
- Claiming that we cannot undertake serious and meaningful assessments over such time periods (Mörner, 2001).
Claiming what you want
In the absence of adequate background data for a serious seismic hazard assessment, it may be tempting to give up, and simply claim what you want to claim. Having started nuclear power without first having solved the handling of the high-level nuclear waste puts an "a posteriori" pressure of "solving" the waste management. One way out of the dilemma was simply to claim that "all works well" and "the waste can be stored under full safety for 100 000 yr" (KBS, 1983; SKB, 2011; Posiva, 2012). This is to substitute science for hope.
Using seismological records
Sweden has an excellent seismological record from the beginning of the 19th century (Båth, 1978). Both Sweden and Finland have low to moderately low seismic activity today, whilst it at the time of deglaciation some 10 000 yr ago was high to very high (Mörner, 1985, 2003, 2011). A seismologic pattern of events achieved from a time window as short as decades can never provide meaningful seismic hazard assessments for longer-term time periods (as illustrated in Fig. 1). Still, this has been done both in Sweden and Finland.
KBS (1983) analysed a 25 yr period (1951–1976) and made predictions for the next 105 –106 yr. This is, of course, to violate the rules of serious hazard assessments. Still, this is what was done. Worse was that it came to form the illusive idea that seismic activity will not pose any problem for a safe deposition in the bedrock for, at least, 100 000 yr (SKB, 2011). In Finland, similar views were expressed (e.g. Posiva, 2012), and they even claimed that the safety would last for 1 million years (STUK, 2011).
Assessing their methodology, the present author extrapolated their seismic activity line backwards (Mörner, 1995) and noted that there was a major change in the level of energy release some 50 yr back in time and the occurrence of high-magnitude palaeoseismic events some 10 000 yr ago (Fig. 2). Furthermore, in the mid-1980s, a high number of events occurred which violated the extrapolation applied by KBS (1983). This should, of course, have invalidated the methodology applied by the nuclear power industries in Sweden and Finland.
The Swedish nuclear industry (SKB, 2011) still relies on the extrapolation of present-day seismic activity (La Pointe et al., 2000), which, they claim, can as a maximum only generate 1 magnitude 6 (M6) event in 100 000 yr (or 1 M7 event in 1 million years) in the region of the proposed nuclear waste repository at Forsmark. This is strongly contradicted by our observational facts covering the last 13 000 yr (Mörner, 2003, 2011).
Using the palaeoseismic records
With the introduction of palaeoseismological studies in Sweden, it became evident that the seismic activity had changed considerably back in time (e.g. Mörner, 1985, 1991, 2003, 2011; Mörner et al., 2000), primarily as a function of the very high rates of glacial isostatic uplift at the time of deglaciation some 10 000 yr ago. The uplift of Fennoscandia has the form of a somewhat skewed cone (Fig. 3) with a maximum uplift of 800 m in 13 000 yr. This means very high vertical rates of uplift, which exceed the maximum horizontal plate motions by a factor of ten. At the same time, the horizontal extensional forces in the radial and tangential directions are high, giving strain rates up to two ten potencies higher than today. Therefore, it is not surprising that Fennoscandia, at the time of deglaciation, was a highly seismic area (Fig. 4), despite the fact that it represents an intra-plate shield area.
The "seismic landscape" of Fennoscandia at the time of deglaciation is characterized by frequent high-magnitude palaeoseismic events (Figs. 4–5, Table 2, Appendix A). Mörner (2011) recorded 7 high-magnitude events during 102 yr from varve year 10 490 to 10 388 BP. Several events must have reached a magnitude of 8 to > 8 (Mörner, 2011). Active faults occur all from northernmost to southernmost Sweden (Mörner, 2004). In northernmost Fennoscandia, there are a number of very large and long fault scarps denoting high-magnitude events (or repeated movements) – i.e. in Norway (Olesen, 1988; Dehls et al., 2000), Sweden (Lundqvist and Lagerbäck, 1976; Bäckblom and Stanford, 1989; Lagerbäck, 1990) and Finland (Kujansuu, 1964) as shown on the map of “active tectonics and postglacial palaeoseismics” (Mörner, 2004, Fig. 5)
| Methodology | Time unit | Maximum magnitude |
|---|---|---|
| Seismology | last 100 yr | < 4.8 |
| Historical data | last 600 yr | < 5.5 |
| Late Holocene PS | last 5000 yr | >> 6 to ∼ 7 |
| Deglacial phase PS | 9–11 000 yr BP | >> 8 |
- ↑ For protection against automatical email address robots searching for addresses to send spam to them this email address has been made unreadable for them. To get a correct mail address you have to displace "AT" by the @-symbol.

